
![]()
Determining genomic architecture
Network analysis reveals 3D chromosome organization
Written by Andrew MS Wong, PhD. Illustration by Diego Pitta de Araujo, PhD | March 2018
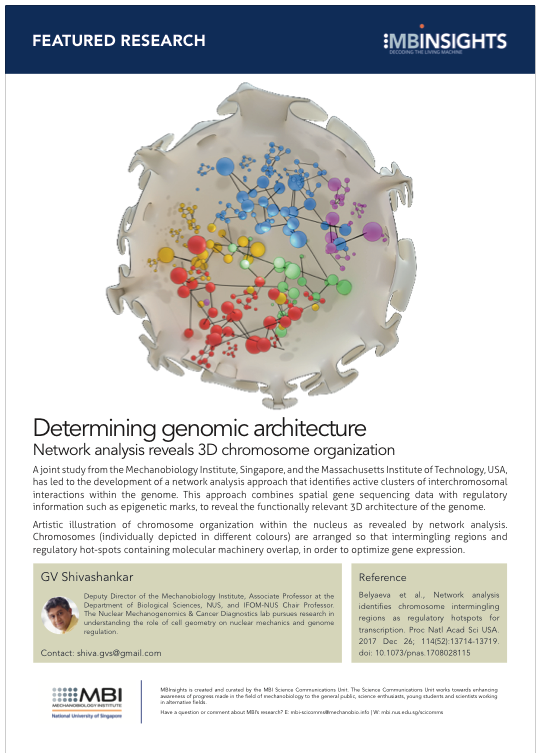
A joint study from the Mechanobiology Institute, Singapore, and the Massachusetts Institute of Technology, USA, has led to the development of a network analysis approach that identifies active clusters of interchromosomal interactions within the genome. This approach combines spatial gene sequencing data with regulatory information such as epigenetic marks, to reveal the functionally relevant 3D architecture of the genome.
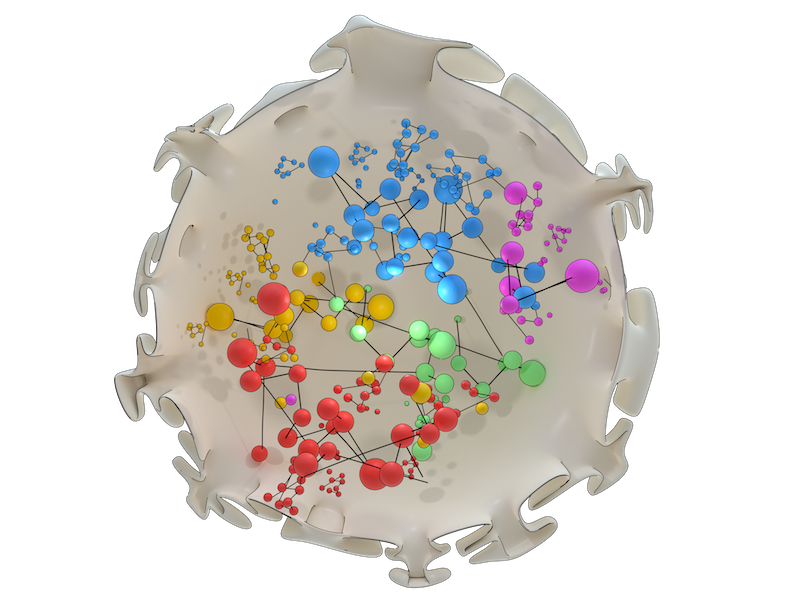
Artistic illustration of chromosome organization within the nucleus as revealed by network analysis. Chromosomes (individually depicted in different colours) are arranged so that intermingling regions and regulatory hot-spots containing molecular machinery overlap, in order to optimize gene expression.
Identifying active clusters for gene regulation
Human DNA is condensed into 23 chromosome pairs, which are then packaged into the nucleus. Importantly, the organization of chromosomes in the nucleus is not random, and this can have a major impact on gene regulation and activation. To visualize the effect of non-randomized organization, think of a chromosome as a subway line. Regions where multiple lines connect and intersect are typically important or busy areas of a city, such as business districts, transport hubs, or major shopping zones. Similarly, regions of the nucleus where different chromosomes intermingle are likely to be important for gene expression. Being able to observe the genomic architecture of how chromosomes are organized in 3D, and importantly, how they interact, would provide new insights into gene expression, regulation, and cell function.
Network analysis unveils how the genomic architecture is optimized for gene expression
Scientists have developed chromosome conformation capture methods to examine the 3D organization of individual chromosomes. These techniques use a chemical treatment to fix the 3D structure of the chromosomes, which is then cut at defined locations by an enzyme, and allowed to reassemble into small fragments. By examining the DNA sequence of these fragments and their abundance, researchers can map out which fragments are likely to associate with one another in 3D space. One of the latest chromosome conformation capture methods, known as Hi-C, can identify chromosomal interactions across the whole genome. However, the large volume of data generated from Hi-C experiments makes it a challenge to identify the chromosome regions that intermingle.
Networking between genes
In order to tackle this problem, a team of scientists led by Prof. GV Shivashankar from MBI and Asst. Prof. Caroline Uhler from the Massachusetts Institute of Technology developed a network analysis approach to identify intermingling regions from different chromosomes that combines computational analysis of spatial data with refinement based on gene regulation information. The researchers designed an algorithm that takes a data matrix from Hi-C experiments and searches for submatrices that exhibit a high degree of chromosomal intermingling. This intermingling data was then refined by comparison with gene regulation information that can be determined from the DNA sequence. For example, information on epigenetic marks (external modifications that can activate or silence genes without modifying the genetic code), regions where DNA-protein interactions occur, and how accessible the DNA was to regulatory proteins were all applied to the intermingling data. These regulatory regions are likely to be dense in genes, and the researchers found that these regions correlated with the intermingling regions identified by the algorithm.
Uncovering regulatory hot-spots at intermingling regions
Using this refined data, the research team were able to classify the intermingling regions into active and inactive clusters. By comparing this data to existing databases, they discovered that active clusters were hotspots for transcription factor binding – proteins that read the DNA sequence to create messenger RNA for eventual protein synthesis. Conversely, they found inactive clusters were likely to associate with epigenetic marks that repress gene expression. When they tested their network analysis approach by experimentally isolating and observing predicted active clusters, they discovered intermingling chromosomes and a high level of the transcription factor RNA polymerase II, validating the accuracy of data from their integrated approach.
This study describes a new network analysis approach that allows the prediction of chromosome intermingling across the whole genome. Using this approach, the researchers were able to identify functionally colocalized regions of the genome – chromosomes which both overlap in 3D and are subject to regulation. This study also revealed that active clusters where chromosomes overlap are arranged to share molecular machinery involved in gene regulation, transcription, and epigenetics, providing further evidence for how chromosome organization within the nucleus is coordinated to optimize gene expression. With this new analysis tool, scientists will be further able to decipher the 3D architecture of the genome.
More on chromosome arrangement
![]()
Determining genomic architecture
A research team from MBI and MIT develop a network analysis approach that integrates spatial gene sequencing data with regulatory information to identify functionally colocalized regions of the genome. Intermingling chromosomes associates with gene regulation machinery at these active clusters in order to optimize gene expression.
The GV Shivashankar Lab

The Nuclear Mechanogenomics & Cancer Diagnostics lab pursues research in understanding the role of cell geometry on nuclear mechanics and genome regulation.
Mallika Nagarajan Research

Saradha Venkatachalapathy Research

The Caroline Uhler Lab

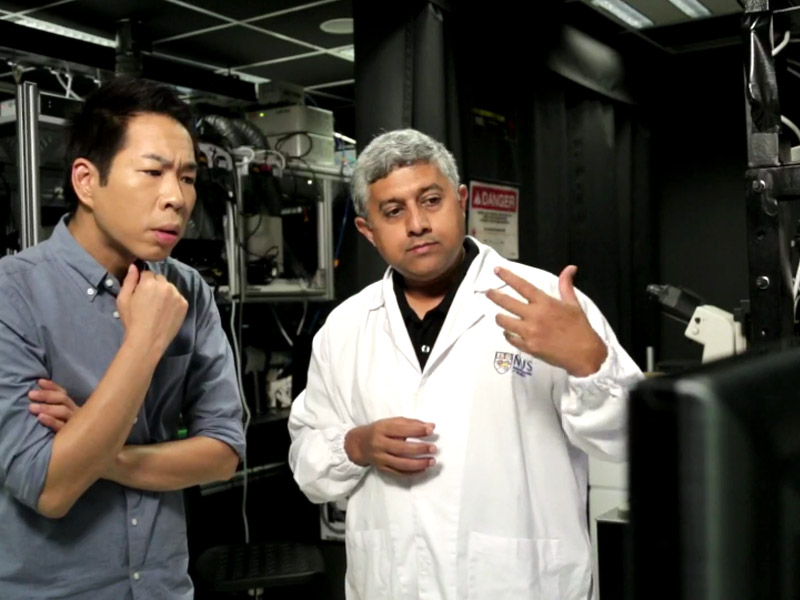
Prof GV Shivashankar featured on Becoming Human, Channel News Asia
MBI Principal Investigator and Deputy Director Professor GV Shivashankar is featured in the Channel News Asia documentary series, Becoming Human: Unnatural Genius to discuss how his lab uses AI and and nuclear mechanogenomic architecture to detect early stage cancer cells.